Advanced Visualization Displays for Smart City Control Centers | FVASEE
Advanced Visualization Platforms for Smart Urban Command Centers
As cities grow and urban systems become more interconnected, municipal leaders are looking for better ways to manage public services, infrastructure, and emergency response. Central to this challenge is the ability to gather, interpret, and act on real‑time data from diverse sources — from traffic sensors and surveillance cameras to environmental monitors and utility networks. In response, modern urban management teams are deploying advanced visualization systems that serve as the operational hub for citywide oversight.
FVASEE’s display solutions are designed to bring clarity and situational awareness to control rooms and command centers, helping city officials make faster, smarter decisions while coordinating complex urban activities. By presenting comprehensive, up‑to‑date information on large, high‑resolution screens, these systems transform raw data into actionable insight.
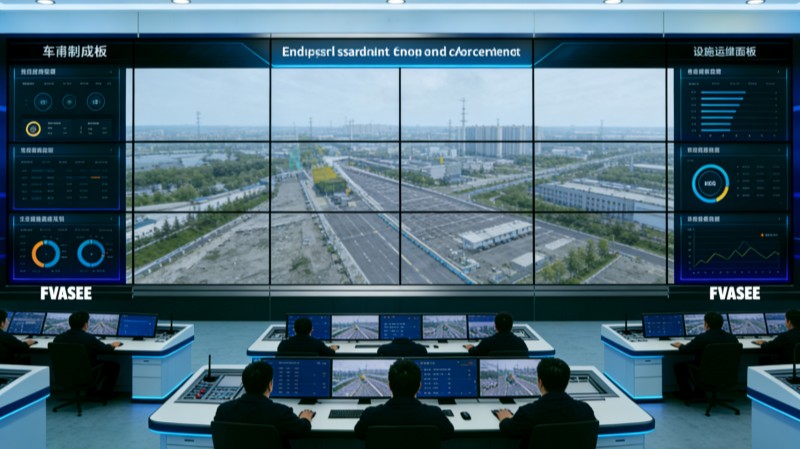
What Urban Command Visualization Systems Do
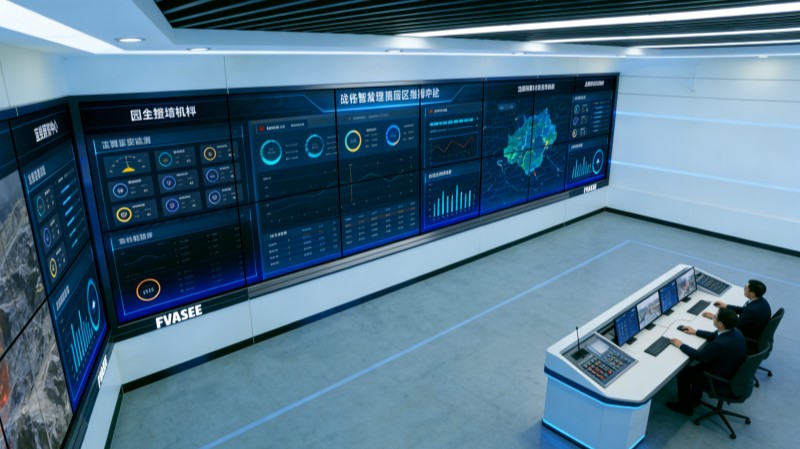
Urban command centers — often referred to as control rooms — are the operational heart of smart cities. They consolidate data from numerous subsystems into a cohesive view that supports real‑time monitoring and planning. Core functions include:
Comprehensive Data Aggregation
Citywide data streams converging on a central platform allow analysts to monitor infrastructure, public safety, traffic flow, utilities, and more from a single interface.
Real‑Time Situational Awareness
Displays showing live feeds highlight current conditions, enabling teams to spot issues such as congestion hotspots, energy grid anomalies, or sudden environmental changes as they occur.
Integrated Monitoring Across Departments
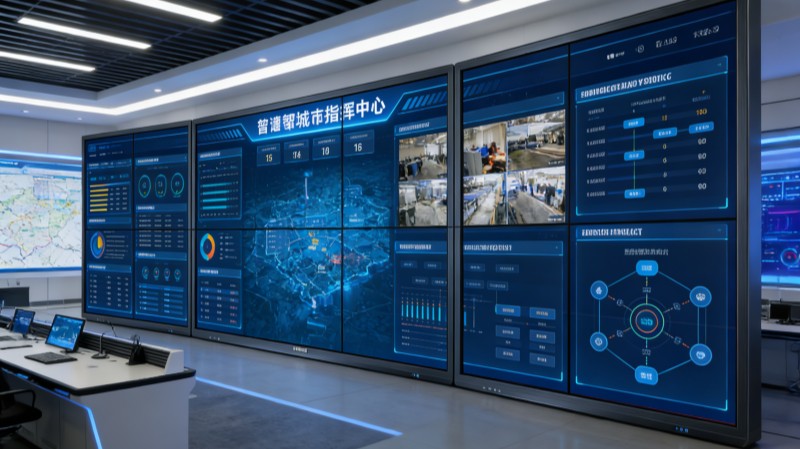
Information from transportation, public works, law enforcement, and environmental departments can be synchronized on collaborative screens, facilitating cross‑agency coordination and rapid responses.
Visual Data Dashboards and Analytic Tools
Visual dashboards transform complex datasets into dashboards that reveal patterns and trends, supporting predictive planning and long‑term strategy.
Key Capabilities of Smart City Display Platforms
High‑Definition Visualization
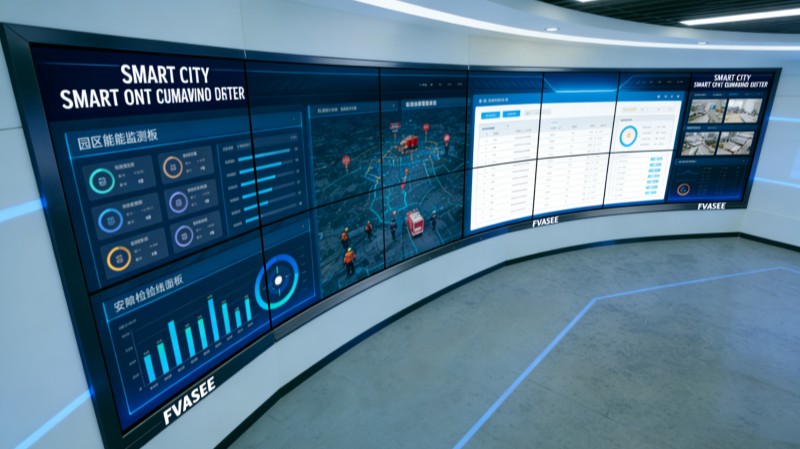
Large‑format, high‑resolution screens ensure that critical information — from transit maps to energy usage charts — is clear and readable even at a distance. This level of visual fidelity is essential for understanding complex urban dynamics.
Seamless Integration with IoT and Data Feeds
Modern control displays are designed to interface with a wide variety of IoT sensors, CCTV networks, and system APIs, enabling real‑time updates and synchronized views of citywide systems.
Support for Hybrid Collaboration
Decision makers in control rooms often work with remote partners or field teams. Integrated conferencing and multi‑display linking support seamless collaboration across locations.
Security and Reliability
Command environments require robust, secure systems capable of operating continuously under high demand. Displays are built to maintain performance over long hours and safeguard data integrity while integrating with secure municipal networks.
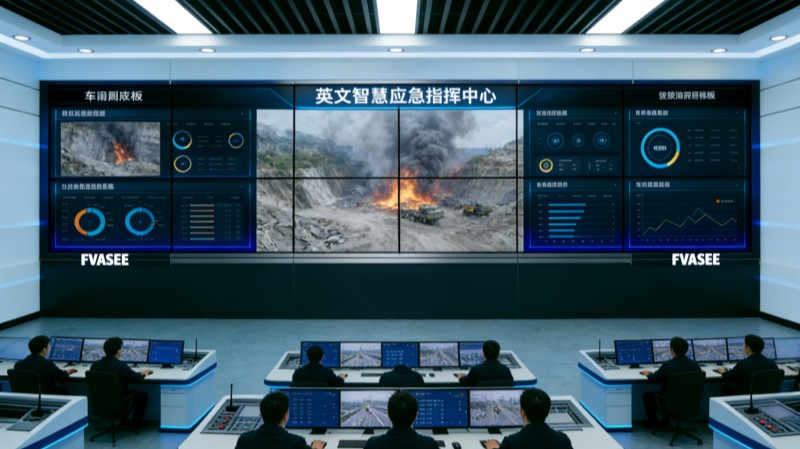
Typical Use Cases in Urban Management
Traffic and Transportation Oversight
Real‑time traffic feeds help authorities monitor congestion, manage public transit timing, and optimize signal flows to improve mobility citywide.
Public Safety and Emergency Response
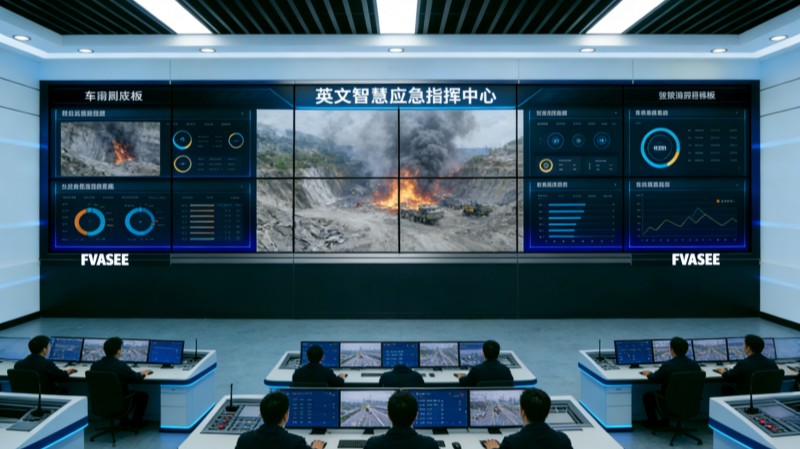
Control platforms integrate surveillance, incident reporting, and alert systems, enabling rapid response to security events, natural disasters, or infrastructure failures.
Utilities and Environmental Monitoring
Monitoring systems track energy usage, water quality, waste levels, and air pollution — helping planners address environmental concerns and improve resource allocation.
Cross‑Agency Coordination
Collaborative dashboards allow transportation, public works, health, and safety departments to plan responses, share insights, and coordinate actions in real time.
Benefits for Urban Governance
Improved Decision Speed
By consolidating vital information in a single, visual platform, control room teams can react quickly to changing conditions, reducing delays in critical decision‑making.
Greater Operational Efficiency
With automated data feeds and intuitive visualization tools, routine monitoring tasks become more efficient, reducing manual data gathering and reporting overhead.
Enhanced Public Transparency
Presentation of real‑time metrics improves accountability and helps officials communicate key performance indicators to stakeholders and the community.
Stronger Predictive Capabilities
Advanced analytic visuals and trend dashboards support proactive planning, enabling cities to anticipate issues such as traffic spikes or energy bottlenecks before they become problems.
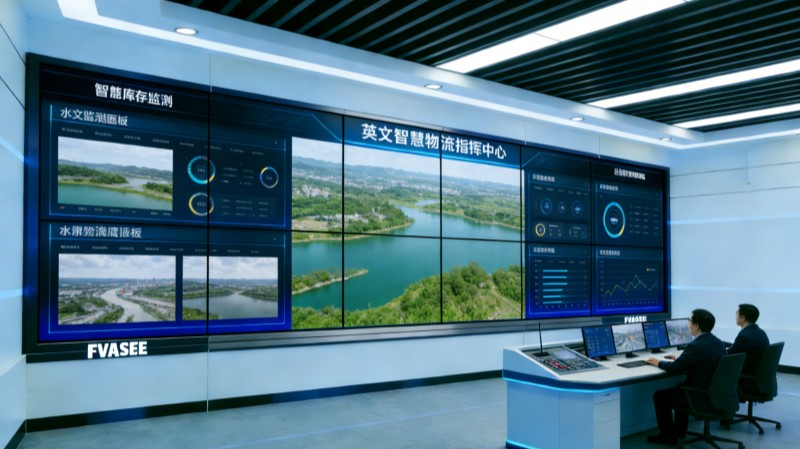
Why FVASEE’s Visualization Displays Are Effective
FVASEE’s solutions are crafted to meet the high demands of urban control environments:
* Commercial‑grade visuals provide clarity under bright room lights and across wide viewing angles.
* Scalable deployment options support both single screens and multi‑panel video walls for command centers of all sizes.
* Integration support ensures compatibility with diverse data sources and system networks.
* Durable, reliable performance matches the 24/7 operational expectations of municipal control environments.
In smart city ecosystems, control room displays serve as the central nexus where urban data converges and becomes actionable insight. By offering real‑time visibility, integrated monitoring, and collaborative tools, these systems help city leaders navigate complexity, respond to urgent events, and improve daily operations across transportation, safety, utilities, and administration.
As urban environments continue to evolve, advanced display platforms are not just a technological enhancement — they are a core capability for urban resilience, transparency, and performance.
- Previous Article:No content for the time being
- Next Article:LED Visualization Systems for Urban Emergency Command Centers | FVASEE