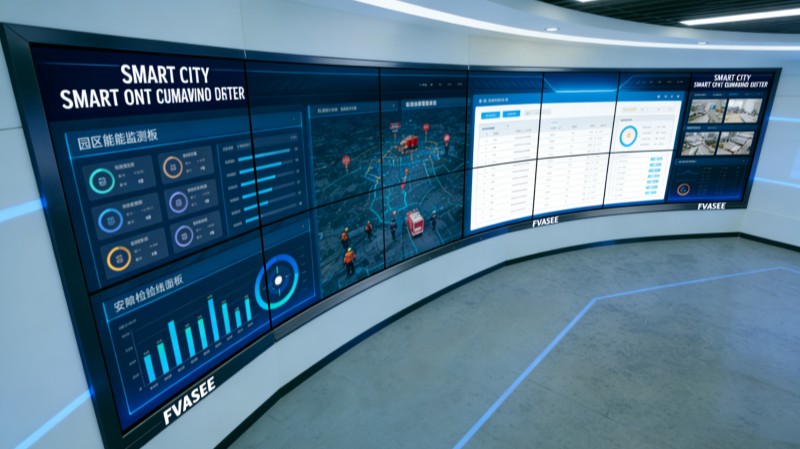
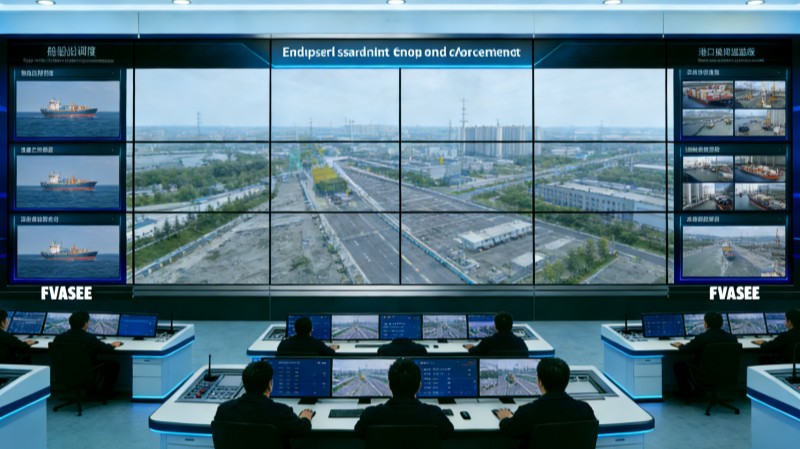
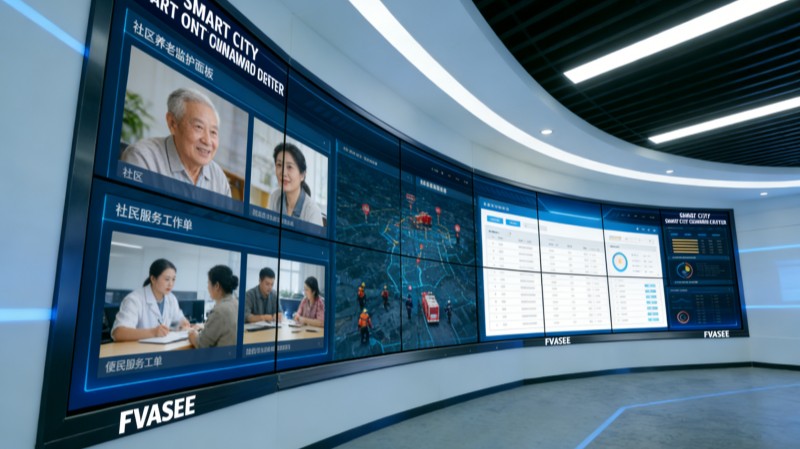
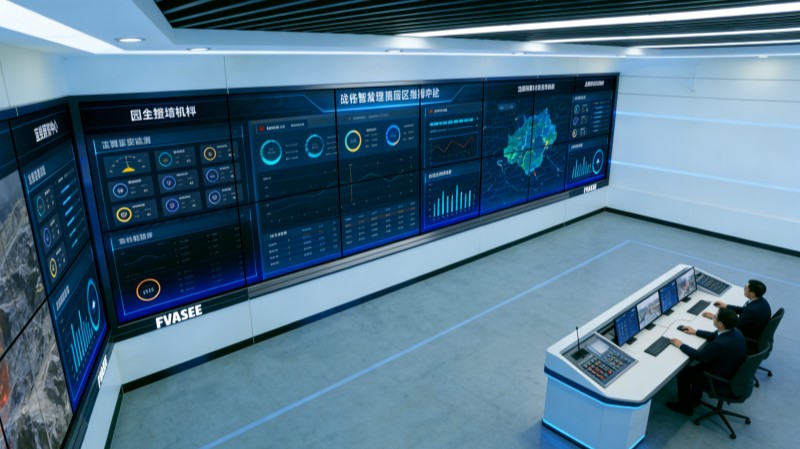
Fvasee Urban Utility Monitoring Displays | Smart City Operations Dashboards
Advanced Display Platforms for Urban Utility Monitoring
Efficient management of public utilities — such as water, electricity, gas, and waste systems — is a cornerstone of modern city operations. With rapid urbanization and rising service demands, city administrators must continuously monitor distributed infrastructure, detect anomalies, and coordinate responses in real time. Traditional monitoring tools, often scattered across separate systems, can make it difficult to achieve a unified operational view.
To address these challenges, many municipalities are deploying integrated display platforms that consolidate data from multiple utility networks into centralized visual dashboards. These high‑performance systems provide city managers with the clarity and responsiveness needed to optimize service delivery, anticipate issues, and improve overall quality of life for residents.
FVASEE’s utility monitoring display solutions are designed to help urban operations teams visualize complex datasets, track performance indicators, and collaborate across departments with confidence.
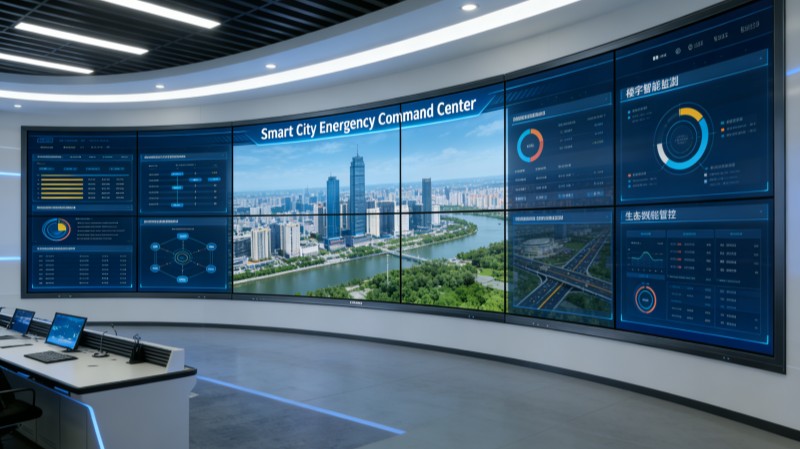
Why Visualization Matters for Utility Oversight
Urban utility systems generate massive quantities of operational data every minute — from consumption trends and pressure readings to outage notifications and environmental metrics. Display solutions tailored to utility monitoring help cities:
Centralize Data from Disparate Sources
Instead of navigating multiple interfaces and dashboards, operators can view water, energy, and waste system statuses within a single visual environment.
Spot Anomalies Quickly
Real‑time dashboards support rapid identification of irregular patterns — such as leakage spikes or voltage drops — enabling faster response and prevention of cascading failures.
Track Performance Metrics Visually
Interactive charts and visual gauges help teams understand usage trends, compare historical performance, and set proactive management strategies.
Coordinate Multi‑Department Response
Shared displays foster collaboration between departments — public works, environmental services, and emergency teams — improving efficiency in both routine operations and critical events.
By visualizing utility performance on large, high‑resolution screens, municipalities turn raw data into actionable insight that guides daily operations and long‑term planning.
Core Capabilities of Urban Utility Display Systems
Unified Dashboards
Large, integrated screens collect, organize, and present utility information across multiple service categories, from electricity distribution to water quality metrics, all in a coherent visual interface.
Real‑Time Data Feeds
Dynamic visualization platforms support live data streams from sensors, IoT networks, and SCADA systems, ensuring that operators see the most current operational conditions.
Interactive Analytics Tools
Visualization displays enable users to drill down into specific datasets, filter by timeframe or region, and annotate insights for discussion during team briefings or strategic reviews.
Hybrid Collaboration Support
Built‑in support for conferencing and remote viewing lets utility planners and field technicians participate in monitoring sessions, share observations, and coordinate responses regardless of location.
These features combine to create an operational hub that supports both tactical decisions and strategic oversight.
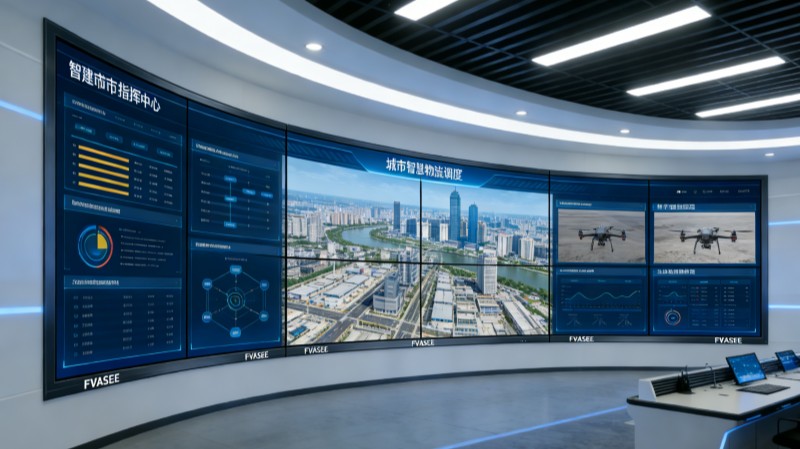
Typical Use Cases in City Utility Monitoring
Water System Management
Operators can track reservoir levels, consumption patterns, and pressure anomalies — all on synchronized visual dashboards that help prevent shortages and identify maintenance needs.
Electricity and Energy Distribution Oversight
Energy usage, grid stability, and outage alerts can be displayed in real time, aiding decisions that ensure continuous power delivery and reduce downtime.
Gas Network Monitoring
Gas pipelines and delivery systems generate performance data that can be visualized to detect irregularities and support rapid intervention when needed.
Waste and Environmental Services
Information about collection schedules, landfill usage, and environmental impact assessments can be integrated into visual dashboards to enhance planning and service delivery.
These use cases illustrate how comprehensive visualization systems support cities in delivering reliable utility services.
Organizational Benefits of Utility Visualization Displays
Faster Detection and Response
Visual dashboards accelerate anomaly detection and help teams coordinate actions to contain issues before they escalate.
Improved Operational Efficiency
Centralized views reduce the time operators spend switching between disparate systems, enabling more productive monitoring sessions.
Stronger Inter‑Department Cooperation
Shared visualization environments promote transparency and alignment between utility departments and city leadership.
Enhanced Strategic Insight
Historical data comparison, trend analysis, and visual performance indicators support long‑range planning and resource allocation.
By improving visibility into utility systems, cities can optimize resource usage, minimize service disruptions, and enhance citizen satisfaction.
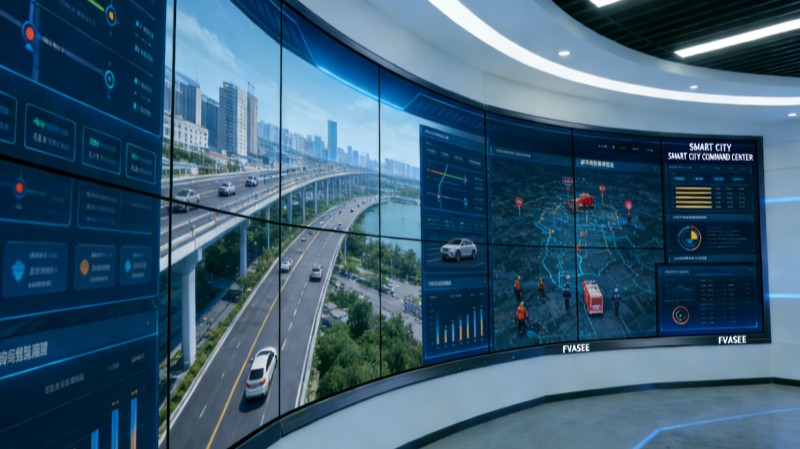
Why Choose FVASEE’s Display Solutions
FVASEE’s platforms are built with urban operations in mind:
High‑Definition Visualization: Displays offer crisp, detailed visuals that remain legible across large control rooms.
Scalable Deployment: From standalone screens to multi‑panel video walls, solutions fit various size and complexity requirements.
Seamless Integration: Systems are compatible with real‑time data feeds, sensor networks, and centralized data platforms.
Robust Performance: Designed for continuous usage in mission‑critical environments without compromise on stability.
This combination of features ensures that utility monitoring — long a complex challenge for urban authorities — becomes manageable, predictable, and visually intuitive.
In the era of smart cities, utility monitoring cannot rely on fragmented data systems. Advanced visualization platforms unify information from water, energy, gas, and waste services, helping city officials gain real‑time insight, improve operational coordination, and make data‑driven decisions. With integrated display systems tailored for utility management, municipal teams are better equipped to ensure reliable provisioning, enhance service longevity, and elevate urban living standards.