Environmental Monitoring Visualization Displays for Urban Management | FVASEE
Advanced Visualization Platforms for Urban Environmental Monitoring
Rapid urbanization has made real‑time environmental oversight a critical component of modern city governance. Municipal authorities must monitor air quality, water resources, emissions, weather conditions, and other ecological indicators to ensure public health, regulatory compliance, and sustainable development. When data streams are fragmented across disparate systems, it becomes difficult to form a clear operational picture or respond swiftly to emerging environmental issues.
To address this challenge, cities are adopting integrated visualization systems that bring multiple environmental data sources together into unified graphical dashboards. These platforms provide city administrators and environmental teams with real‑time insight, helping them track trends, detect anomalies, and coordinate responses with confidence. FVASEE’s display solutions are engineered to support these critical tasks, offering clarity, responsiveness, and scale for environmental operations centers.
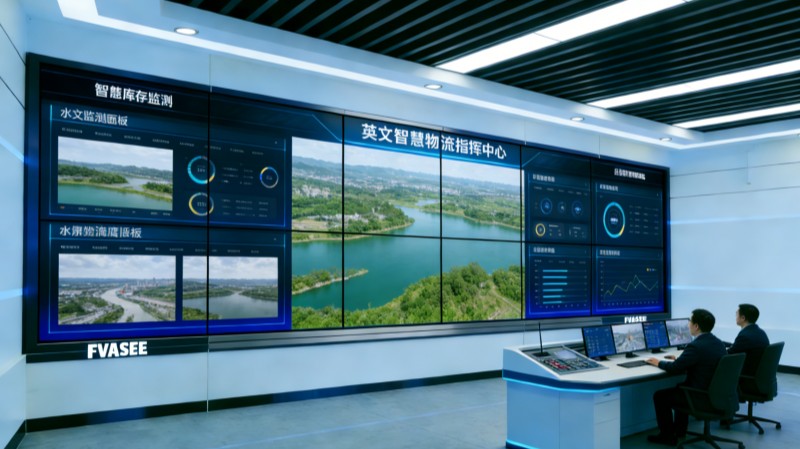
Why Real‑Time Visualization Matters for Environmental Oversight
Urban environmental monitoring encompasses a wide range of data types — from air pollution indexes and noise levels to water quality metrics and weather conditions. Visualization systems tailored for environmental oversight help city teams:
Aggregate Diverse Data in One View
Instead of reviewing data across multiple screens and interfaces, operators can see everything — including sensor feeds, historical trends, and alert thresholds — in a holistic visual context.
Detect Changes and Issues Promptly
Rapid identification of air quality spikes, contamination alerts, or weather anomalies enables faster action to protect public health and mitigate risk.
Support Policy and Regulatory Compliance
Interactive dashboards assist authorities in evaluating whether environmental parameters remain within compliance thresholds and help prepare reports for stakeholders.
Facilitate Cross‑Department Coordination
By presenting environmental data alongside public safety and utility information, visualization systems help departments coordinate efforts for events such as pollution spikes or severe weather.
This unified view transforms raw environmental metrics into actionable intelligence that supports both tactical response and long‑term sustainability planning.
Key Features of Environmental Visualization Systems
High‑Definition Visual Dashboards
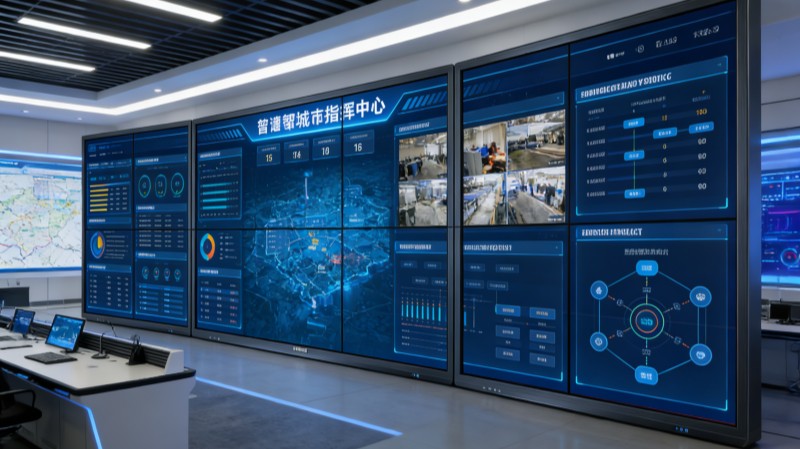
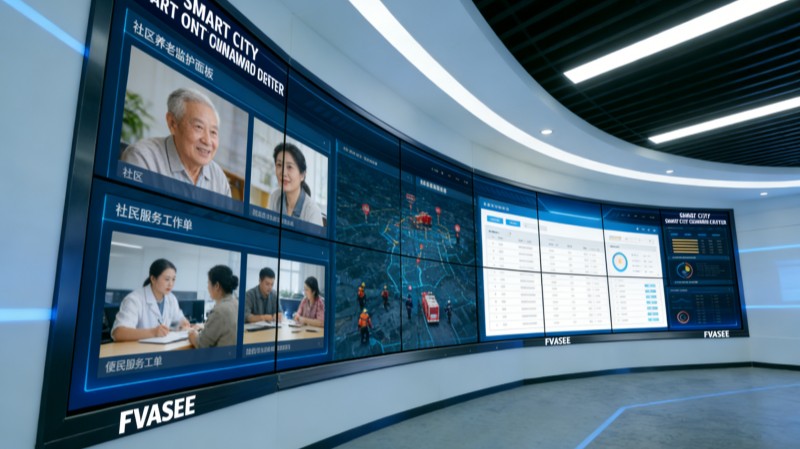
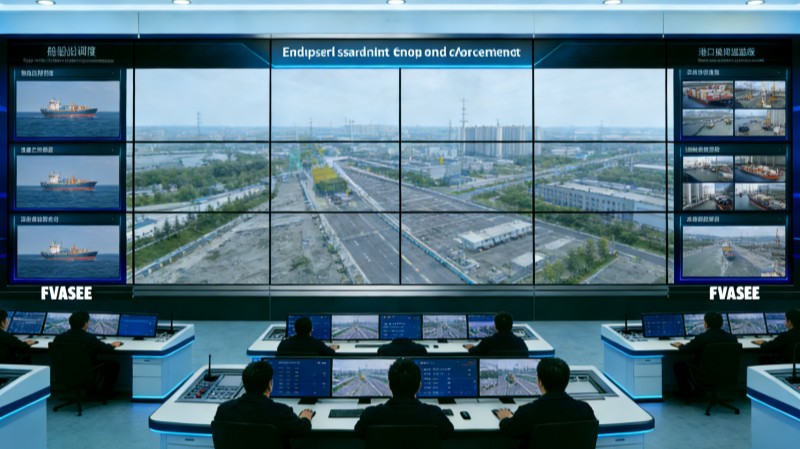
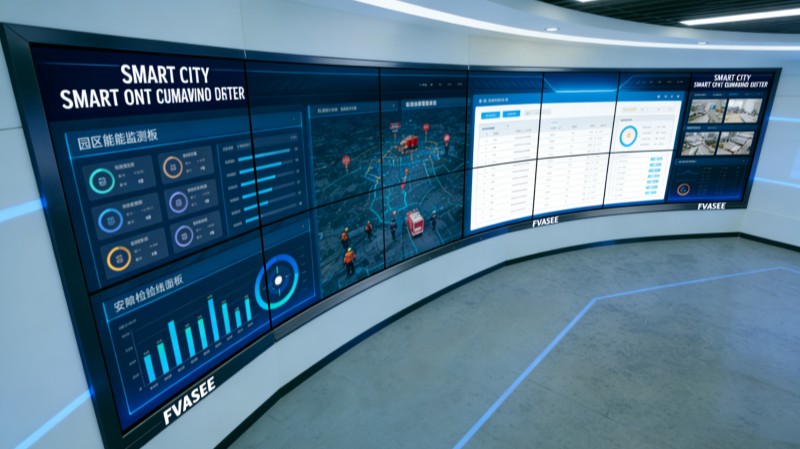
Large screens with high resolution present air quality indices, water resource metrics, and environmental alerts in formats that are easy to read from any vantage point in a control room.
Live Data Integration
Platforms supported by live feeds from IoT sensors, weather stations, and monitoring networks ensure that operators always work with the latest available information.
Interactive Analysis Tools
Users can drill down into specific data streams, compare current conditions against historical patterns, and annotate insights for meetings or decision sessions.
Hybrid Collaboration Support
Built‑in support for remote participation and multi‑display linking allows regional partners, scientists, or external advisors to join monitoring sessions with full visual context.
These features help create an environmental operations hub that supports both immediate decision‑making and strategic oversight.
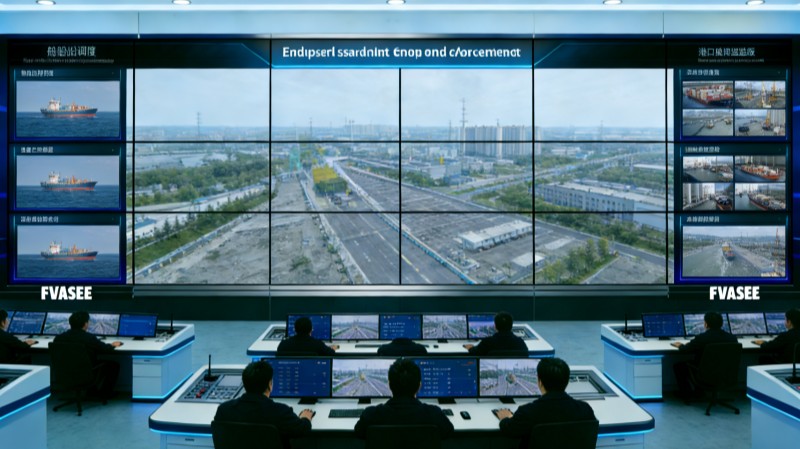
Typical Use Cases in Urban Environmental Monitoring
Air Quality and Pollution Tracking
Operators can visualize particulate matter, nitrogen dioxide, and other pollutant levels across different city zones — enabling targeted responses and public notifications.
Water Quality and Resource Management
Data from water treatment plants, reservoir sensors, and distribution networks can be integrated to ensure safe, compliant water delivery and early detection of contamination.
Weather and Extreme Condition Alerts
Environmental dashboards can incorporate meteorological data to help forecast storms, heatwaves, or flood risks, allowing authorities to plan proactive measures.
Noise and Urban Comfort Monitoring
Cities can visualize noise levels or other livability indicators to support planning decisions that enhance citizen well‑being.
These use cases demonstrate the breadth of environmental oversight and the value of visualization in synthesizing complex data into meaningful visuals.
Organizational Benefits
Faster Identification and Response
Visual dashboards accelerate anomaly detection and help teams act before conditions worsen.
Improved Transparency and Reporting
Clear visuals support internal briefings and external reporting, enhancing accountability and public trust.
Enhanced Cross‑Functional Coordination
Shared visual platforms align environmental, safety, and utility departments around common insights and operational priorities.
Better Long‑Term Planning
Trend analysis and historical comparisons support strategic decisions related to sustainability, public health, and urban resilience.
By elevating environmental data into clear visual narratives, cities can improve oversight, strengthen performance, and protect quality of life.
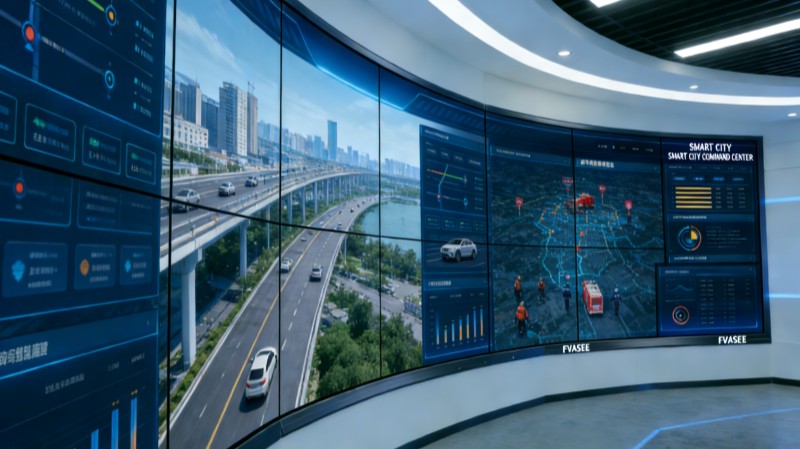
Why FVASEE’s Display Solutions Are Effective
FVASEE’s visualization platforms are built to meet the demands of environmental operations centers:
Scalable Configuration: From standalone screens to multi‑panel setups, solutions fit diverse room sizes and data complexity.
High Brightness and Clarity: Displays maintain visual integrity even under bright lighting and across wide control room layouts.
Seamless Data Integration: Systems connect with sensor networks, weather APIs, and monitoring databases for synchronized visuals.
Reliability for Continuous Use: Built for 24/7 operation with stable performance ideal for mission‑critical monitoring.
These capabilities help environmental teams move from reactive monitoring toward proactive, insight‑driven governance.
Effective environmental monitoring is essential for sustainable urban development and public health protection. Advanced visualization platforms consolidate multi‑source data into intuitive, real‑time displays that support rapid interpretation, decisive action, and collaboration across city departments. By implementing integrated visualization solutions like those from FVASEE, urban authorities can enhance environmental oversight, improve operational transparency, and build more resilient, livable cities.