Urban Operations Visualization Displays | Real-Time Smart City Dashboards
Real-Time Visualization Platforms Powering Urban Operations and Governance
As cities evolve into more complex and interconnected ecosystems, municipal leaders need tools that help them oversee public services, infrastructure, and community programs with precision. Urban management teams increasingly rely on real-time data from diverse sources — including traffic systems, environmental sensors, public safety feeds, and utility networks — to make informed decisions and respond to changing conditions proactively.
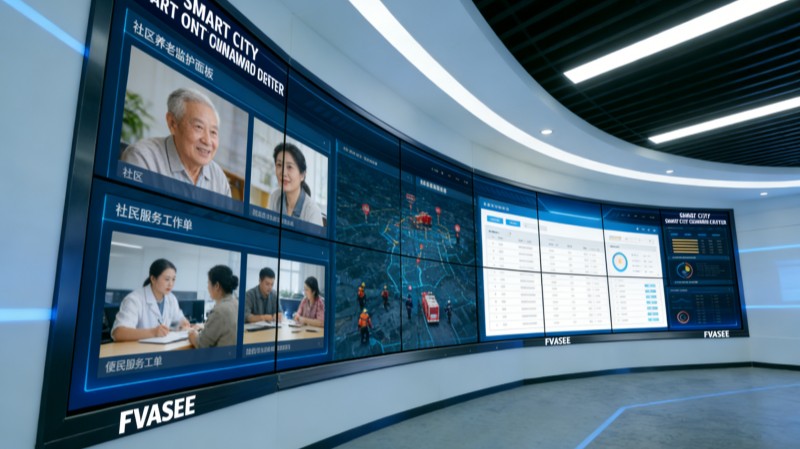
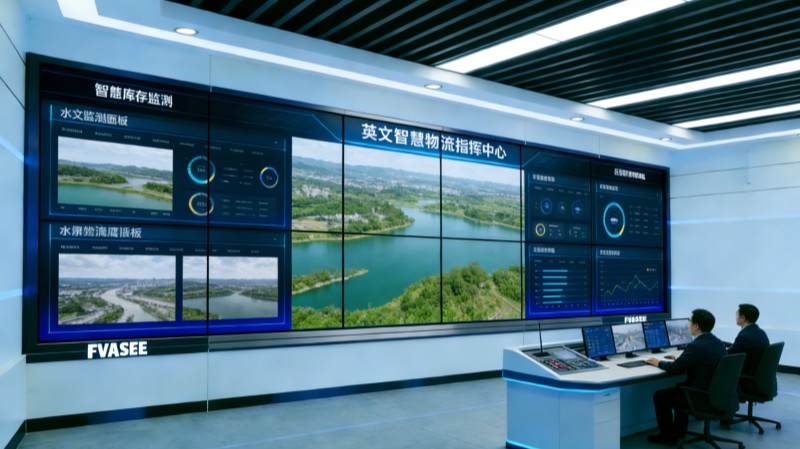
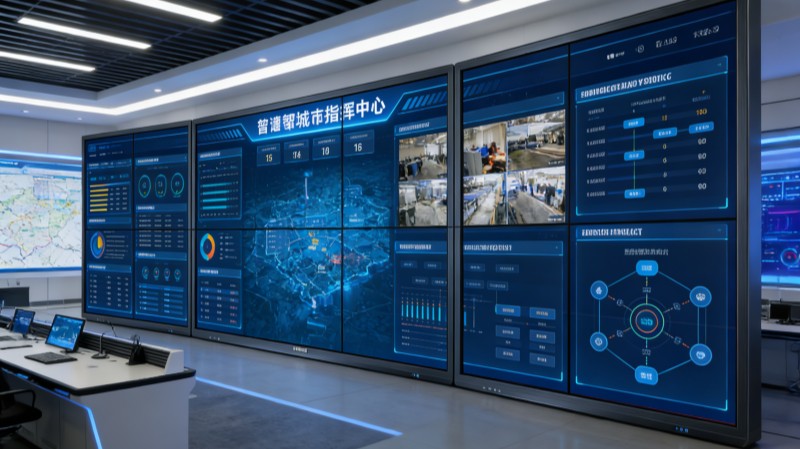
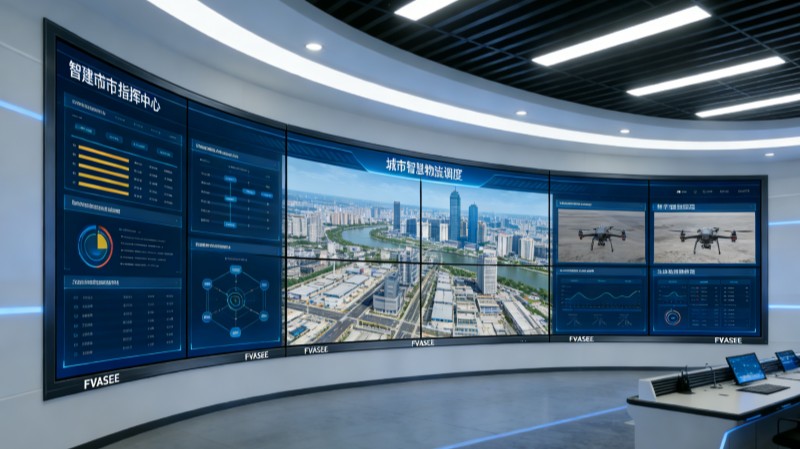
Advanced large-display visualization systems have become central to modern Urban Operations Centers (UOCs). These platforms consolidate multi-source data into unified visual dashboards that support situational awareness, cross-department coordination, and strategic planning. FVASEE’s visualization displays are engineered to help cities interpret complex information quickly, identify patterns, and act with confidence.
The Role of Unified Display Systems in Urban Governance
Urban operations generate vast volumes of dynamic information every second. To turn this raw data into actionable insight, city administrators need visualization platforms that can:
Integrate Diverse Data Streams
By bringing together feeds from traffic networks, surveillance cameras, environmental monitors, and public service datasets, visualization systems create a comprehensive picture of citywide activity.
Support Real-Time Dashboard Analysis
Visual dashboards present key metrics and indicators in formats that reveal trends, anomalies, and correlations at a glance — essential for rapid decision-making.
Enable Multi-Agency Collaboration
Interactive display environments allow representatives from transportation, public safety, utilities, and health departments to review shared information and coordinate responses.
Enhance Predictive Planning
Visual trends and historical data comparisons support proactive strategies, enabling urban planners to anticipate issues such as congestion spikes or service bottlenecks before they escalate.
These capabilities help cities transition from reactive to predictive modes of governance, strengthening resilience and operational efficiency.
Key Features of Urban Visualization Displays
High-Definition Visual Canvases
Large, high-resolution screens ensure that complex dashboards, detailed maps, and live video feeds are easy to interpret from any vantage point in an operations center.
Seamless Integration with Smart Infrastructure
Modern visualization systems interface with IoT networks, traffic systems, public safety sensors, weather stations, and service platforms, providing a synchronized operational view.
Interactive Analytics and Annotation
Operators can interact with visual content directly — zooming into maps, highlighting key metrics, and annotating dashboards to support collaborative analysis and briefing.
Hybrid Connectivity and Remote Participation
With built-in support for conferencing and multi-display linking, urban teams can include remote experts or regional partners in decision sessions without losing visual context.
These features together create a reliable, high-impact environment for urban management tasks of varying complexity and scale.
Typical Applications in City Operations
Integrated Traffic and Mobility Oversight
Visualization platforms allow operators to monitor congestion, transit status, and route performance in real time, facilitating adjustments to signal priorities or travel advisories.
Environmental and Public Health Monitoring
Air quality, noise levels, weather conditions, and public health indicators can be visualized alongside operational feeds to inform policies and responses.
Public Safety and Incident Coordination
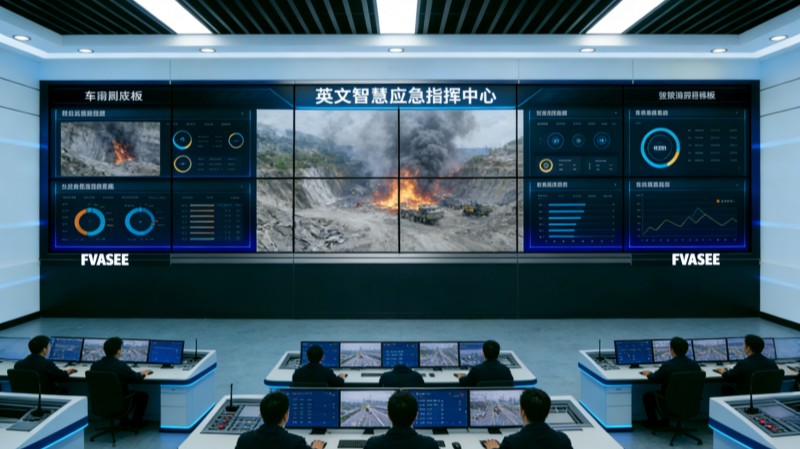
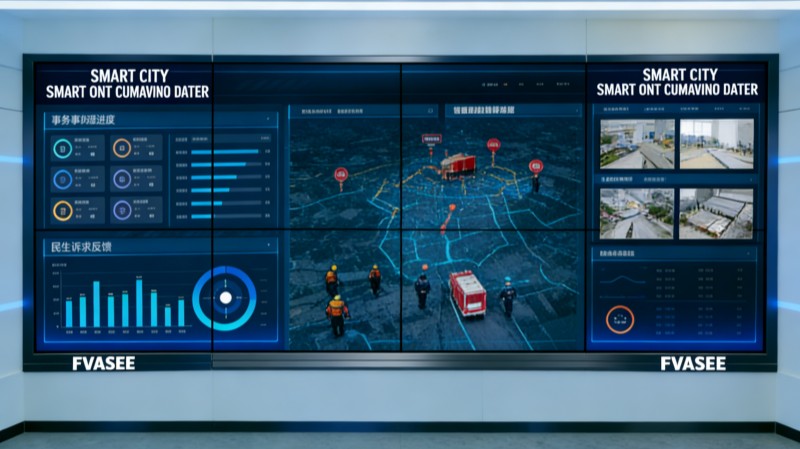
During emergencies or significant events, unified dashboards display multi-channel information — such as CCTV feeds, alert systems, and field reports — enabling quick assessment and resource allocation.
Utility and Infrastructure Management
Data from water, energy, and waste systems can be integrated into visual analytics platforms to help planners detect issues early and optimize service delivery.
These use cases illustrate how visualization displays transform disparate datasets into coordinated operational insight, enhancing governance at every level.
Benefits for Urban Administrators and Citizens
Faster, Better Decisions
Visual dashboards reduce the time required to interpret complex data, enabling urban teams to act rapidly and confidently.
Stronger Collaboration Across Departments
Shared visualization environments foster interagency coordination and break down silos that can slow response times.
Improved Operational Transparency
Visualizing performance indicators helps administrators communicate priorities and outcomes to stakeholders and the public.
Enhanced Urban Resilience
By supporting predictive insights and real-time awareness, visualization platforms enable cities to anticipate challenges and mitigate risks effectively.
Cities that leverage real-time display systems position themselves to deliver more responsive services and better quality of life for residents.
Why FVASEE’s Visualization Displays Excel
FVASEE’s solutions are designed for the unique demands of urban operations:
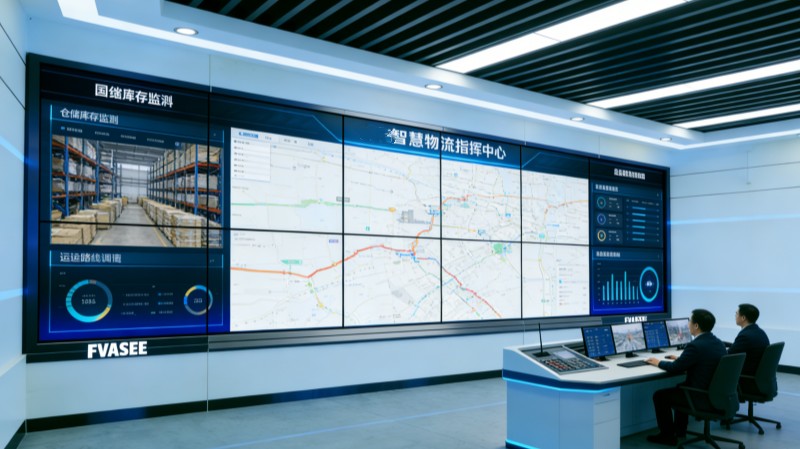
Scalable Display Architecture: Supports configurations from single large screens to multi-panel video walls depending on room size and use cases.
Reliable Performance: Commercial-grade hardware ensures consistent clarity and uptime for mission-critical operations.
Seamless Integration: Built to connect with various data sources and management systems across urban infrastructure.
Intuitive Interaction: Interactive capabilities enable operators to engage with data directly during briefings and planning sessions.
Together, these features help transform traditional control rooms into dynamic visualization hubs that enhance situational awareness, coordination, and strategic insight.
Urban governance demands tools that can interpret complexity and present clarity. Visualization platforms built on high-performance display systems provide the foundation for real-time situational awareness, cross-department collaboration, and strategic planning across city operations. By integrating diverse data streams into unified, interactive visual canvases, cities can improve agility, responsiveness, and service delivery performance.
Adopting advanced visualization solutions — like those from FVASEE — enables urban leaders to see the whole picture, make informed decisions, and drive smarter governance for today’s connected cities.