Urban Traffic Control Visualization Systems | Fvasee LED Display Solutions for Smart Cities
LED Visualization Platforms Enhancing Urban Traffic Management
Effective traffic management is essential for modern cities striving to reduce congestion, improve safety, and support efficient movement of people and goods. Municipal traffic command teams must process massive amounts of dynamic data — including live camera feeds, sensor networks, route analytics, and incident alerts — in order to make timely decisions. Traditional traffic monitoring tools often lack the capacity to display complex, real-time information in a clear and actionable way.
Advanced LED visualization systems are transforming how urban traffic operations centers function by providing high-resolution displays that consolidate multi-source data into comprehensive visual dashboards. FVASEE’s LED display solutions for transportation management help authorities see the full picture, respond faster to disruptions, and coordinate traffic flows with greater precision.
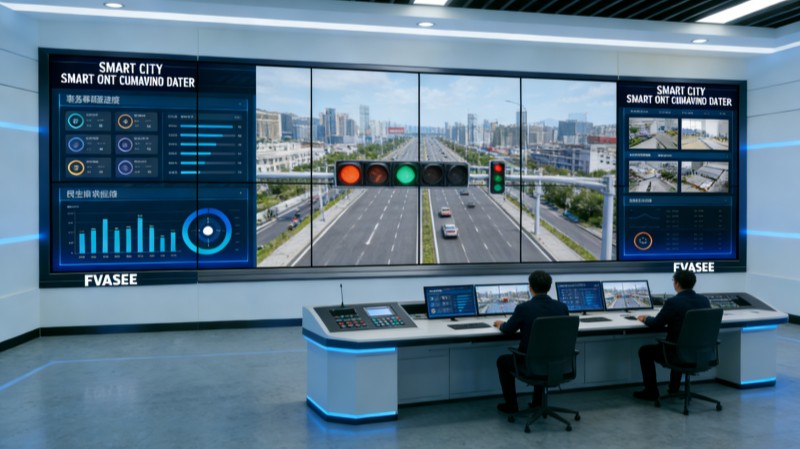
The Evolving Landscape of Traffic Operations
Urban traffic management is no longer limited to static sign boards and basic surveillance monitors. Today’s cities integrate:
Adaptive Traffic Signals: Sensors and analytics that adjust signal timings based on real-time conditions.
Incident Detection and Alerts: Automatic notifications for vehicle breakdowns, accidents, or road hazards.
Traveler Information Systems: Digital updates for citizens on congestion, travel times, and route alternatives.
Multimodal Integration: Coordination across buses, rail, and shared mobility networks.
These components generate vast quantities of real-time data, which must be visually organized and presented for quick interpretation. LED visualization platforms offer the display capacity and clarity needed in modern traffic command operations, enabling city teams to maintain continuous situational awareness.
Key Capabilities of LED Traffic Visualization Walls
Real-Time Data Aggregation
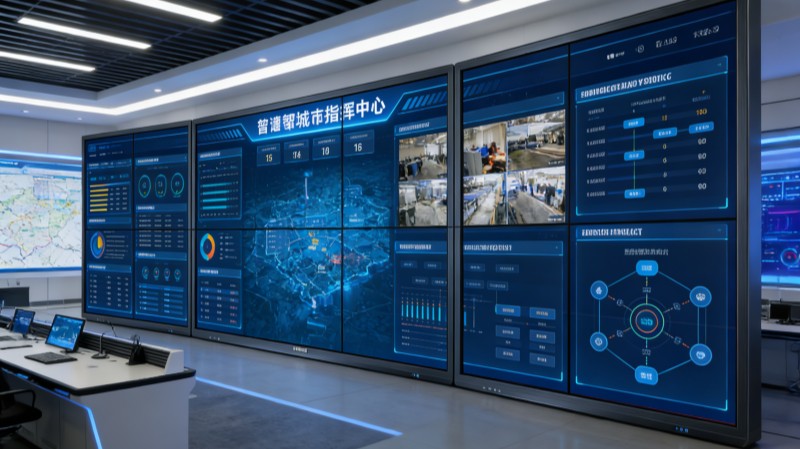
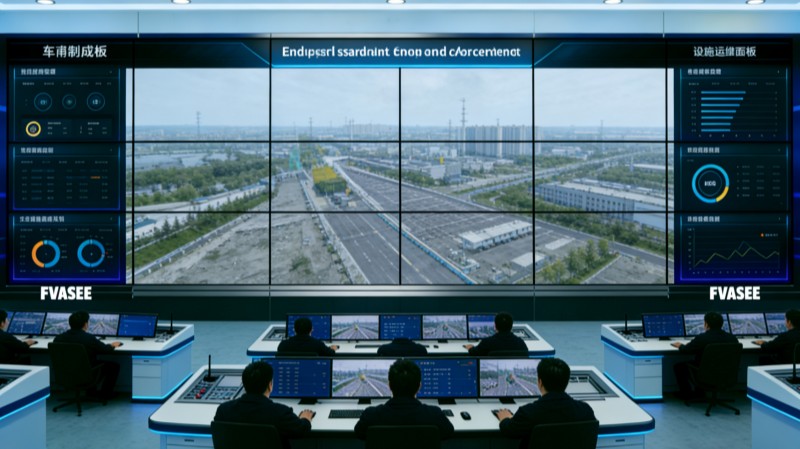
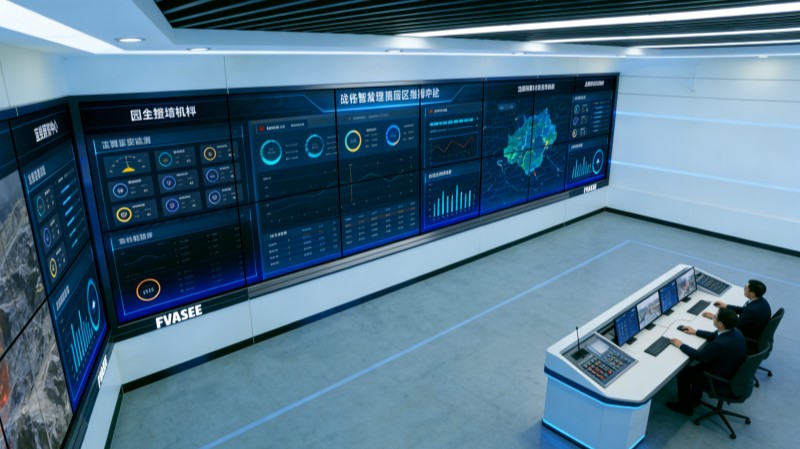
Integrated displays show feeds from traffic cameras, sensor networks, and analytics tools simultaneously, giving operators a unified view of traffic conditions.
High Visibility and Clarity
Large, high-brightness LED panels ensure that critical information — such as maps, live video, and performance charts — remains visible from all angles, even in well-lit control rooms.
Multi-Source Integration
Visualization platforms pull in data from ITS (Intelligent Transportation Systems), weather alerts, public transit status, and emergency services, supporting a comprehensive operational view.
Rapid Incident Response
With consolidated visuals, operators can detect, verify, and respond to traffic incidents more quickly, reducing congestion and enhancing public safety.
These capabilities elevate traffic operations centers from passive monitoring stations to proactive traffic command hubs — equipped to maintain fluid urban mobility.
Typical Use Cases in Urban Traffic Management
Congestion Monitoring
Large LED displays help traffic teams track congestion hotspots, monitor bottlenecks, and make real-time adjustments to signal timing or routing recommendations.
Emergency Incident Visualization
During accidents or unexpected road closures, control center teams use high-resolution visuals to view live footage, coordinate with field response teams, and provide advisories to the public.
Traveler Information Displays
LED visualization solutions extend beyond control rooms — public digital signage and messaging systems share updates about travel times, incidents, and route alternatives to reduce commuter frustration.
Integrated Mobility Coordination
By displaying data from buses, trains, ride-share services, and traffic sensors together, urban managers can plan around multimodal transportation needs and optimize overall flow.
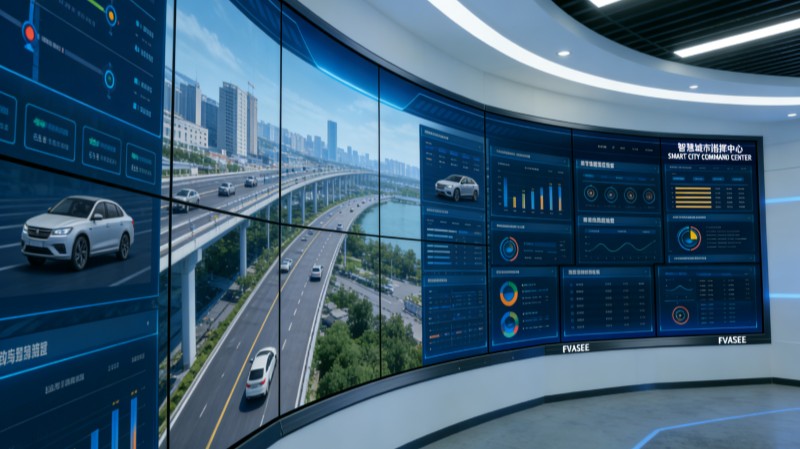
Benefits for Urban Traffic Operations
Faster Decision-Making
Visual dashboards reduce the time it takes to interpret complex data, enabling teams to make informed adjustments to traffic patterns more quickly.
Improved Safety Outcomes
Clear visuals of real-time incidents help authorities dispatch response teams rapidly and issue traveler alerts that reduce secondary incidents.
More Efficient Traffic Flow
By leveraging data visualization for congestion management, cities can improve throughput and reduce travel times during peak periods.
Enhanced Public Confidence
Proactive traffic management and transparent traveler information help build trust in the city’s ability to manage mobility challenges effectively.
These benefits contribute to stronger urban transportation systems and better overall quality of life for residents and visitors.
Why FVASEE’s LED Visualization Systems Excel
FVASEE’s LED display solutions are engineered with the demands of city traffic operations in mind:
Scalable Display Architecture: From single large panels to multi-screen video walls, configurations fit a range of control room sizes.
Commercial-Grade Reliability: High brightness, consistent performance, and longevity support continuous, mission-critical operations.
Seamless Data Integration: Systems are built to integrate real-time feeds from cameras, sensors, and traffic analytics platforms.
User-Focused Visualization: Customizable dashboards and layouts help operators prioritize critical information at a glance.
These features make FVASEE’s visualization platforms a valuable tool for any city seeking to modernize its traffic control capabilities and improve mobility outcomes.
Traffic operations are becoming increasingly data-driven, requiring advanced visualization platforms that can present complex, real-time information clearly and reliably. LED display technology delivers the clarity, scale, and integration needed in urban command environments, enabling operators to monitor conditions, coordinate responses, and make rapid decisions that improve safety and optimize traffic flow.
By adopting FVASEE’s LED visualization solutions, cities can elevate their traffic management strategies and build resilient, responsive transportation networks that better serve their communities.