Visual Command Displays for Urban Disaster and Resilience Operations | FVASEE
Real-Time Visualization for Urban Crisis and Resilience Management
In an era where cities face an increasing frequency of natural hazards — such as floods, storms, earthquakes, or extreme weather events — effective disaster response and recovery have become fundamental to urban resilience. When a crisis unfolds, municipal authorities, emergency services, and utility teams must swiftly interpret incoming data, coordinate multi-agency actions, and monitor changing conditions to protect lives and infrastructure.
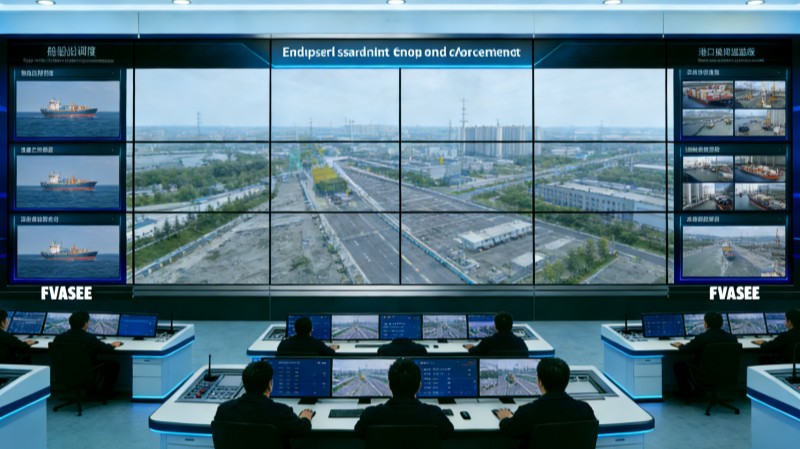
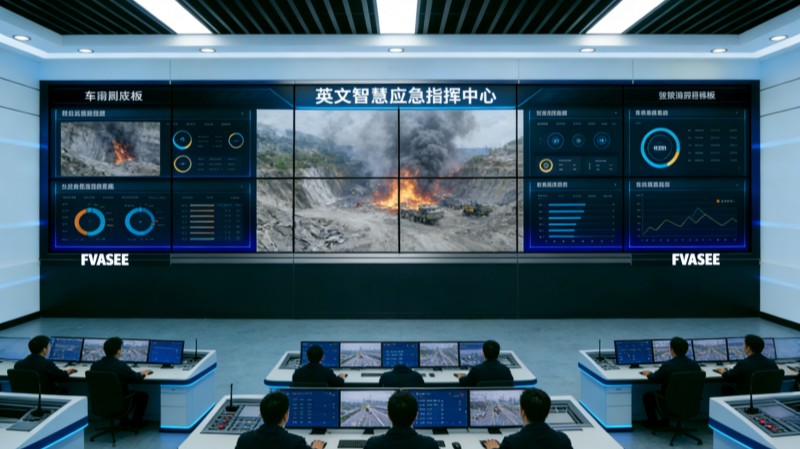
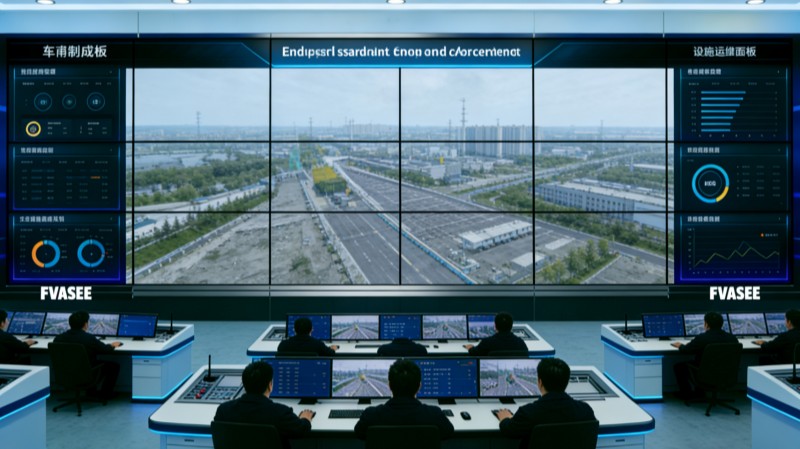
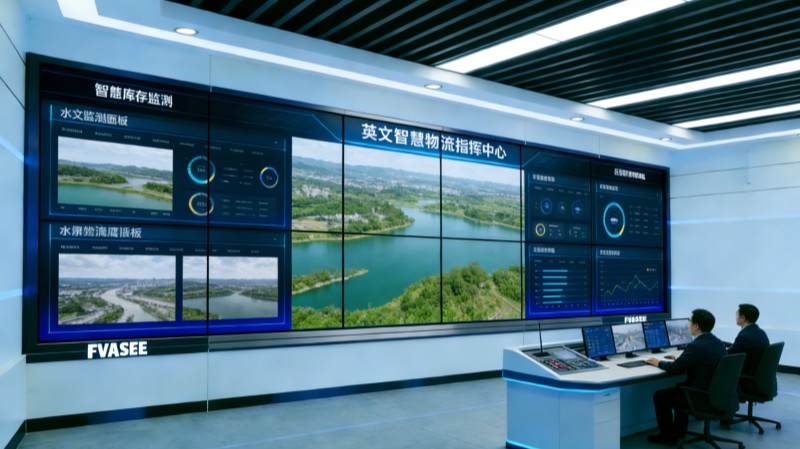
Advanced visualization platforms provide disaster response teams with the critical situational awareness they need. Large-format display systems consolidate real-time information from multiple data sources — including sensors, satellite feeds, field reports, and weather models — into unified visual dashboards that accelerate decision-making and improve operational coordination. FVASEE’s display solutions are designed to support these high-demand environments with reliability, clarity, and scalability.
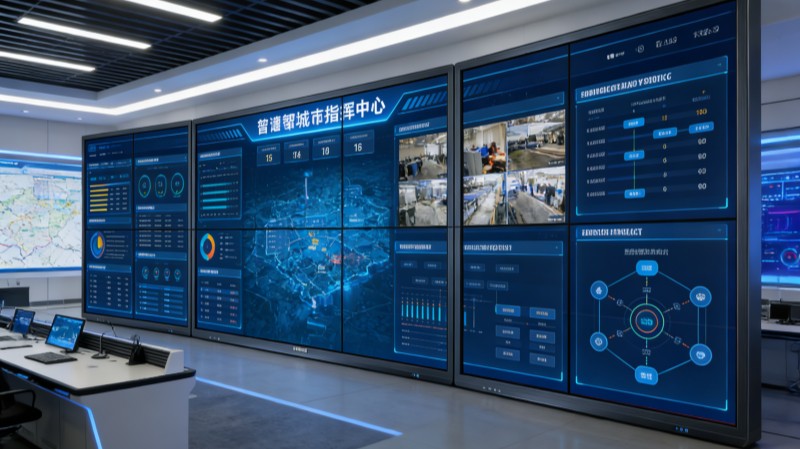
Why Visualization Is Crucial for Disaster Recovery
During disaster response and recovery, time is of the essence. Information comes fast, and the ability to quickly grasp evolving conditions can make the difference between effective action and delayed response. Visualization systems help by:
Centralizing Multi-Source Information
Operational teams can view live feeds from sensors, cameras, and monitoring systems together on a unified visual interface, eliminating the need to navigate multiple standalone applications.
Supporting Rapid Interpretation
Heat maps, risk indicators, route closures, and resource status are more easily understood when presented visually rather than in text or tabular formats.
Enhancing Coordination Among Agencies
By presenting shared visual dashboards, fire departments, police, public works, and emergency medical teams can operate from a common operational picture, reducing miscommunication.
Visualizing Predictive Modeling
Displays allow planners to overlay forecast models — such as flood paths or wind movements — with live data, helping teams plan pre-emptive measures as well as post-event recovery actions.
These capabilities transform raw data streams into actionable insight, empowering teams to make informed decisions under pressure.
Core Capabilities of Disaster Response Display Systems
High-Definition Multi-View Walls
Large LED or video wall displays aggregate multiple live feeds — such as satellite imagery, sensor status, and field data — into a comprehensive view that supports continuous awareness across a control room.
Real-Time Data Integration
Visualization platforms can pull in feeds from weather APIs, utility sensors, traffic management systems, and emergency alert networks, ensuring operators always have the latest information.
Interactive Analysis Tools
Operators can interact with visual content — zooming into maps, annotating charts, and toggling layers — to highlight priority areas or explore different scenarios.
Cross-Location Connectivity
Remote teams, field responders, and regional partners can participate in synchronized display sessions, sharing insights and coordinating responses even when geographically dispersed.
These features help ensure that disaster recovery efforts are anchored in an accurate, comprehensive understanding of evolving situations.
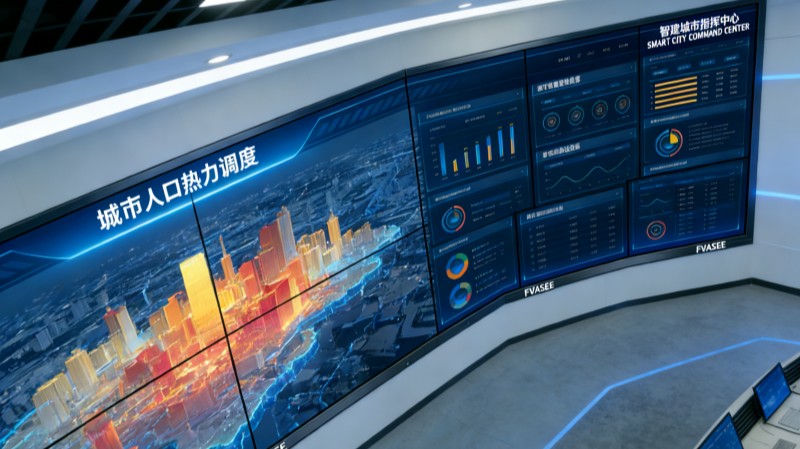
Typical Use Cases in Urban Crisis Management
Emergency Coordination Hubs
During incidents such as major storms or infrastructure failures, control centers equipped with visualization systems act as nerve centers where decision-makers monitor conditions and deploy resources efficiently.
Evacuation and Route Planning
Visual maps can display blocked roads, optimal evacuation routes, and shelter locations — helping authorities guide citizens safely and avoid bottlenecks.
Resource Tracking and Allocation
Visual dashboards enable tracking of available personnel, medical teams, equipment, and supplies, helping planners allocate resources where they are most needed.
Post-Event Damage Assessment
After an event, visualization systems assist teams in comparing before/after imagery, location-specific data, and field reports to coordinate recovery and reconstruction.
These scenarios illustrate how display platforms extend beyond monitoring into actionable disaster response and recovery support.
Organizational Benefits of Visualization
Improved Response Time
Real-time visuals accelerate the interpretation of critical data, enabling teams to respond more quickly to emerging threats.
Stronger Interagency Collaboration
A shared operational view reduces miscommunication and aligns efforts across departments, improving coordination during high-stress events.
Greater Situational Confidence
Visual dashboards that combine predictive models with live feeds help decision-makers anticipate risks and plan multi-stage responses.
Enhanced Resilience Planning
Historical trend analysis and predictive visualization equip city planners with the tools needed for risk mitigation and future disaster preparedness.
By enhancing situational awareness and collaboration, visualization systems become indispensable in both reactive operations and proactive resilience strategies.
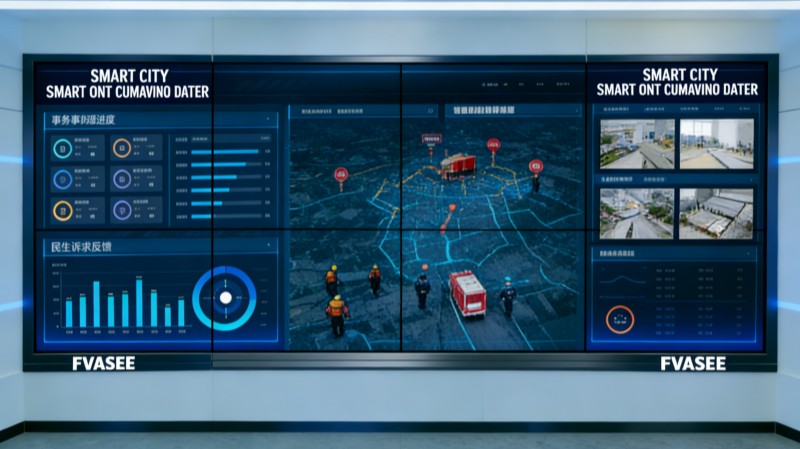
Why FVASEE’s Solutions Excel in Crisis Environments
FVASEE’s display platforms are engineered to meet the demands of mission-critical environments:
Commercial-Grade Brightness and Reliability: Ensures clarity in large control spaces under varied lighting conditions.
Scalable and Flexible Displays: From single screens to video walls that span entire control rooms.
Seamless Integration with Operational Data: Compatible with multiple data sources, sensor networks, and analytic platforms.
Interactive and Collaborative Features: Supports multi-team annotation sessions and remote participation.
This combination of capabilities not only supports real-time disaster response but also strengthens long-term urban resilience planning.
Urban disaster response and recovery require tools that can present complex, multi-stream data quickly and clearly. Visualization platforms built on high-performance display technology provide operational teams with the situational awareness, collaboration capabilities, and analytic insight needed to manage crises effectively. By integrating real-time data, predictive modeling, and cross-agency coordination into unified visual dashboards, cities can respond faster, collaborate more efficiently, and build more resilient communities for the future.
- Previous Article:Environmental Monitoring Visualization Displays for Urban Management | FVASEE
- Next Article:No content for the time being